
Position-specific score matrices
Global and local alignment tools like BLAST are typically used to search for and align homologous sequences which are related by common descent. However we may also wish to search for short sequence motifs which are similar primarily because they have a common function.
These sequences might be homologous if they are related through common descent, but they may also have evolved convergently. Certainly extremely short and simple functional motifs like splice sites can evolve independently again and again, and nobody would claim that every intron1 in a genome is homologous. And certainly beyond some length sequences cannot evolve convergently, the state space of nucleotides is far too large and the fitness landscape far too uneven.
I’m not sure where the limit is (and given the lack of phylogenetic information in short sequences it may be fruitless to even attempt to find out), but when looking for short motifs we are usually interested in them for their common function rather than their common origin.
One way to find these motifs is to use a position-specific score matrix, or PSSM. This is similar to a substitution score matrix, but instead of specifying the scores or distances for amino acid or nucleotide replacements, a PSSM specifies the scores for observing particular amino acids or nucleotides at specific positions.
Take the example of ABRE. This is a nucleotide motif, and Hattori et al. discovered that its consensus sequence is ACGTG G/T C. Gómez-Porras et al. constructed a matrix of counts at each position of the motif from an alignment of 47 ABRE sequences:
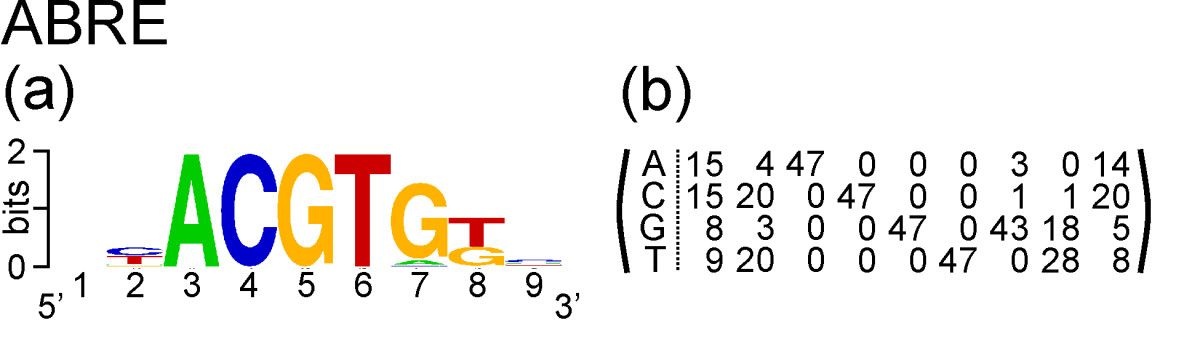
The count matrix, and the PSSM we will derive from it, has four rows and nine columns. It has four rows corresponding to the four nucleotides that occur in DNA: A, C, G and T. It has nine columns corresponding to nine positions in the motif.
To convert these counts into a PSSM, first we will convert the frequency matrix into a matrix of probabilities. The probability of observing a particular nucleotide at a given position is simply the observed count for that nucleotide at that position, divided by the number of sequences in the alignment:
| 1 | 2 | 3 | 4 | 5 | 6 | 7 | 8 | 9 | |
|---|---|---|---|---|---|---|---|---|---|
| A | 0.32 | 0.09 | 1.00 | 0.00 | 0.00 | 0.00 | 0.06 | 0.00 | 0.30 |
| C | 0.32 | 0.43 | 0.00 | 1.00 | 0.00 | 0.00 | 0.02 | 0.02 | 0.43 |
| G | 0.17 | 0.06 | 0.00 | 0.00 | 1.00 | 0.00 | 0.91 | 0.38 | 0.11 |
| T | 0.19 | 0.43 | 0.00 | 0.00 | 0.00 | 1.00 | 0.00 | 0.60 | 0.17 |
Within each column the probabilities sum to one, because one of the four nucleotides has to be observed at each position.
Just as for substitution score matrices, we can calculate log-odds scores using the odds ratio of observed to expected frequencies. The expected frequency of each nucleotide or amino acid at each position is usually its observed frequency across large database of sequences. For nucleotides we can keep things simple by assuming all equal frequencies, in which case the expected frequency is always 0.25. For amino acids this assumption is less reasonable due to the higher variation in frequencies; rare residues like tryptophan are many times less common than abundant residues like leucine.
Assuming all equal frequencies in this case, the log-odds probability of each nucleotide at each position in half-bit units is simply 2log2(Pi/0.25), where Pi is the observed frequency of nucleotide i at that position.
| 1 | 2 | 3 | 4 | 5 | 6 | 7 | 8 | 9 | |
|---|---|---|---|---|---|---|---|---|---|
| A | 0.70 | -3.11 | 4.00 | -∞ | -∞ | -∞ | -3.94 | -∞ | 0.51 |
| C | 0.70 | 1.53 | -∞ | 4.00 | -∞ | -∞ | -7.11 | -7.11 | 1.53 |
| G | -1.11 | -3.94 | -∞ | -∞ | 4.00 | -∞ | 3.74 | 1.23 | -2.47 |
| T | -0.77 | 1.53 | -∞ | -∞ | -∞ | 4.00 | -∞ | 2.51 | -1.11 |
As usual, we convert these to the nearest whole integer:
| 1 | 2 | 3 | 4 | 5 | 6 | 7 | 8 | 9 | |
|---|---|---|---|---|---|---|---|---|---|
| A | 1 | -3 | 4 | -∞ | -∞ | -∞ | -4 | -∞ | 1 |
| C | 1 | 2 | -∞ | 4 | -∞ | -∞ | -7 | -7 | 2 |
| G | -1 | -4 | -∞ | -∞ | 4 | -∞ | 4 | 1 | -2 |
| T | -1 | 2 | -∞ | -∞ | -∞ | 4 | -∞ | 3 | -1 |
We can now compute the log-odds score of any sequence of 9 nucleotides
matching the ABRE motif. For example, the log-odds score of the sequence
GCACGTGGC is -1 + 2 + 4 + 4 + 4 + 4 + 4 + 1 + 2 = 24.
But now consider the sequence CCACGTGAC. Its log-odds score is 1 + 2 + 4 + 4 + 4 + 4 + 4 + -∞ + 2 = -∞. It doesn’t matter how good the rest of the match
is, because an A nucleotide was never observed in the 8th position of the
original sequence alignment used to calculate the PSSM, its score is negative
infinity.
Is this score reasonable? Maybe not, as examples of this motif with A at
the eighth position could exist, but were not included in the 47-sequence
alignment used to calculate the PSSM because they are rare or because of
biases in selecting the 47 sequences. To address this problem, averaging can
be used.
There are several different averaging methods, but I think the most elegant calculates log-odds using odds ratios weighted by observed probabilities. To calculate the log-odds score in half-bits for a given nucleotide j at some position of the PSSM, for each nucleotide i scale the odds ratio for replacement of i by j, Pij/qiqj, by the observed probability of nucleotide i at that position, Pi. Sum the scaled odds ratios and then as usual double the binary logarithm to get the score in half- bits.
This method therefore incorporates the probability of observing a nucleotide at a position because of replacement, and not just from the observed nucleotides in the original motif alignment which may be incomplete due to bias or sampling error. For proteins this will be the same, just with 20 amino acids instead of four nucleotides.
Let’s calculate the log-odds score in half-bits for A at the eighth position
of the ABRE motif using averaging. We will assume equal base frequencies, and
use the substitution matrix below:
| A | C | G | T | |
|---|---|---|---|---|
| A | 0.13 | 0.03 | 0.03 | 0.06 |
| C | 0.03 | 0.13 | 0.06 | 0.03 |
| G | 0.03 | 0.06 | 0.13 | 0.03 |
| T | 0.06 | 0.03 | 0.03 | 0.13 |
The formula to calculate the log-odds in this case is:
2log2(PA × (PAA / qAqA) + PC × (PCA / qCqA) + PG × (PGA / qGqA) + PT × (PTA / qTqA))
From our motif sequence alignment, the observed probabilities are:
PA = 0.00, PC = 0.02, PG = 0.38, PT = 0.60
From the substitution matrix, the observed replacement probabilities are:
PAA = 0.13, PCA = 0.03, PGA = 0.03, PTA = 0.06
And the expected probability qij is always 1/4 × 1/4 = 1/16 because we have assumed equal base frequencies. Because this is a constant, as a shortcut we can divide the entire sum by 1/16, or equivalently multiply by 16. The log-odds score in half-bits is then:
2log2((0.00 × 0.13 + 0.02 × 0.03 + 0.38 × 0.03 + 0.60 × 0.06) × 16) = -0.77
In the final PSSM used for inference, we will round this to -1 as the nearest integer. The final score matrix will be:
| 1 | 2 | 3 | 4 | 5 | 6 | 7 | 8 | 9 | |
|---|---|---|---|---|---|---|---|---|---|
| A | 0 | -1 | 2 | -2 | -2 | 0 | -2 | -1 | 0 |
| C | 0 | 1 | -2 | 2 | 0 | -2 | 0 | -1 | 1 |
| G | 0 | -1 | -2 | 0 | 2 | -2 | 2 | 0 | 0 |
| T | 0 | 1 | 0 | -2 | -2 | 2 | -2 | 1 | 0 |
As you can see, this solves the problem of negative infinity scores. But averaging has introduced a new problem: the PSSM scores are now very flat. This would be reasonable when the amount of data (that is the number of sequences) is small, but when we have a lot of data it is undesirable.
In the case of ABRE, the tetranucleotide sequence ACGT is genuinely
invariable, as this element is needed for binding of bZIP transcription
factors to the ABRE. If we had a comprehensive alignment of thousands of
ABRE sequences without any variation in the “ACGT” element, it would be
unreasonable to assign such high scores to alternative nucleotides at those
positions, as we have in our PSSM derived by averaging.
Unlike averaging, Bayesian inference naturally accounts for the amount of information available given some data set. For computing PSSMs, we can use a Bayesian method known as pseudocounts to adjust the PSSM scores to a degree which is appropriate given more (adjust less) or less (adjust more) data.
For more information on PSSMs, read “Using substitution probabilities to improve position-specific scoring matrices” by Henikoff and Henikoff. You may also recognize them as inventors of the BLOSUM amino acid matrices!
Update 13 October 2019: for another perspective on sequence motifs, consult Chapter 2 of Bioinformatics Algorithms (2nd or 3rd Edition) by Compeau and Pevzner.
-
Maybe every self-splicing intron? ↩