
PAM vs BLOSUM score matrices
Amino acids, nucleotides or any other evolutionary character are replaced by others at some rate. For example, imagine an evolutionary sequence with three possible states, A, B and C. If substitution model is time-reversible, there will be three transition rates, A<>B, B<>C and A<>C.
Suppose the rates are 1, 1 and 0 respectively in units of substitution per 100 characters per unit of time. After one unit of time, in a 300 character long sequence originally composed equally of As, Bs and Cs, we expect there to have been one A to B substitution and one B to C substitution. If we are comparing two homologous sequences in living organisms, because one unit of time has passed for both sequences, we would expect two A to B and two B to C substitutions between the present day sequences.
No matter how long we run this process for, there will never be a direct replacement of A by C. There will also never be an A to C substitution under a so-called infinite sites model, where no more than one substitution can occur at a single site.
However since A to B and B to C substitutions are common, under a finite sites model eventually B will be replaced by C at a site where A was previously replaced by B. This indirect replacement of A by C (or equivalently in a time-reversible model, C by A) becomes more likely the longer the time period separating the homologous sequences.
I simulated sequence evolution based on the the above scenario, running the simulation for 10 units of time. From this substitution I observed the following counts for each site pattern:
| A | B | C | |
|---|---|---|---|
| A | 91 | 9 | 0 |
| B | 5 | 86 | 9 |
| C | 0 | 9 | 91 |
Within this relatively short duration, it doesn’t appear as if any A<>C substitutions have occured. However when I reran the simulation for 100 units of time:
| A | B | C | |
|---|---|---|---|
| A | 55 | 35 | 10 |
| B | 29 | 36 | 35 |
| C | 20 | 36 | 44 |
As you can see, many “A” characters have been replaced with “C” and vice versa. More generally, under a finite sites model multiple substitutions cause the distribution of site pattern counts to become much flatter beyond simply increasing the proportion of off-diagonal relative to diagonal counts. The PAM and BLOSUM score matrices account for multiple substitutions in radically different ways.
The PAM matrices for amino acids, along with the single letter abbreviations used for genetically encoded amino acids, were developed by Margaret Dayhoff. They were originally published in 1978, and based on the protein sequences Dayhoff had been compiling since the 1960s, published as the Atlas of Protein Sequence and Structure.
The name PAM comes from “point accepted mutation”, and refers to the replacement of a single amino acid in a protein with a different amino acid. These mutations were identified by comparing highly similar sequences with at least 85% identity, and it is assumed that any observed substitutions were the result of a single mutation between the ancestral sequence and one of the present day sequences.
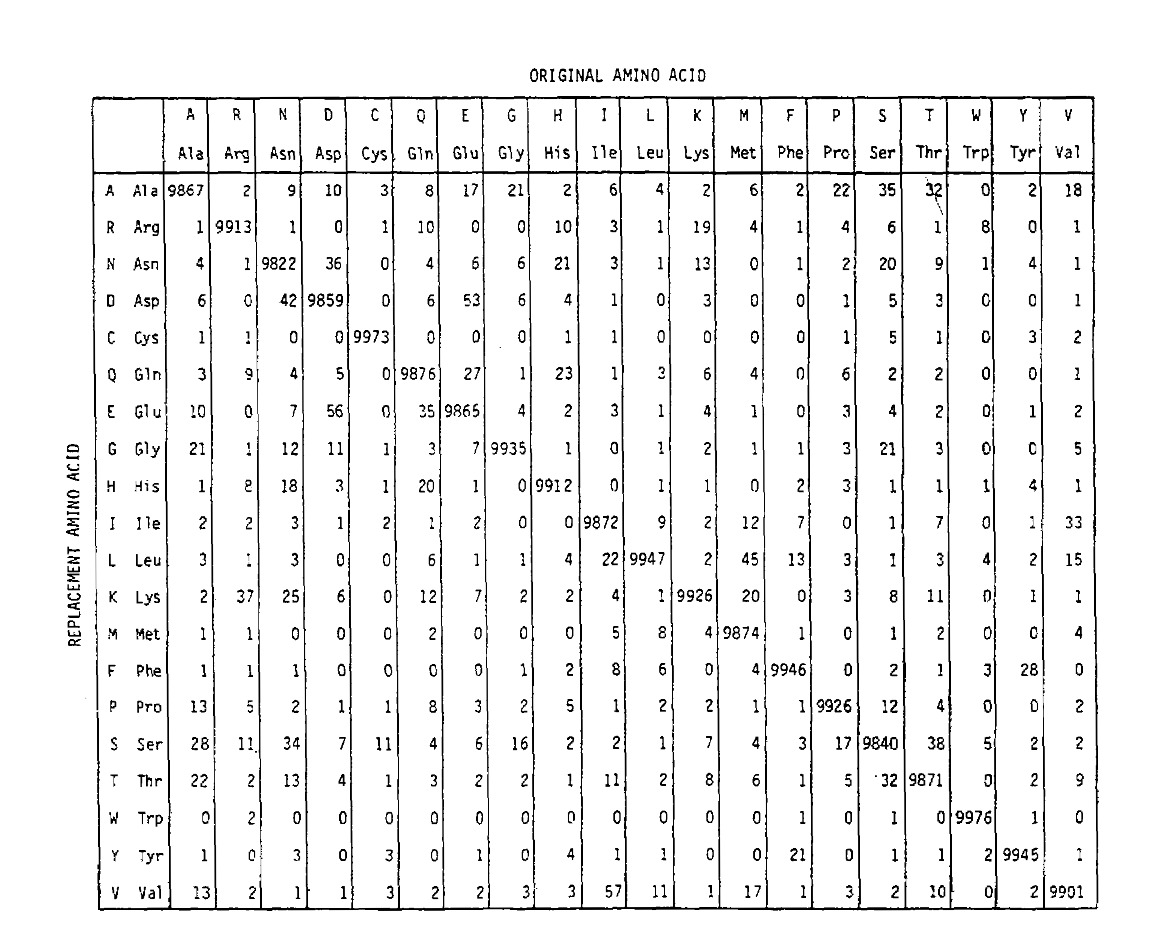
PAM also defines a time unit, where 1 PAM is the time in which 1/100 amino acids are expected to undergo a mutation. The PAM1 probability matrix shows the probability of the amino acid at column j being replaced by the amino acid at row i. It was calculated from Dayhoff’s PAM counts, and rescaled to be 1 PAM unit of time. As you can see, the off-diagonal probabilities in the PAM1 matrix are all very small (all elements were scaled by 10,000 for legibility):
To calculate the amino acid replacement probabilities for longer time durations, the matrix can be multiplied by itself the corresponding number of times. Thus the PAM250 probability matrix, describing the replacement probabilities given 250 PAM units of time, was derived by raising the PAM1 probability matrix to the power 250 (all elements were scaled by 100 for legibility):
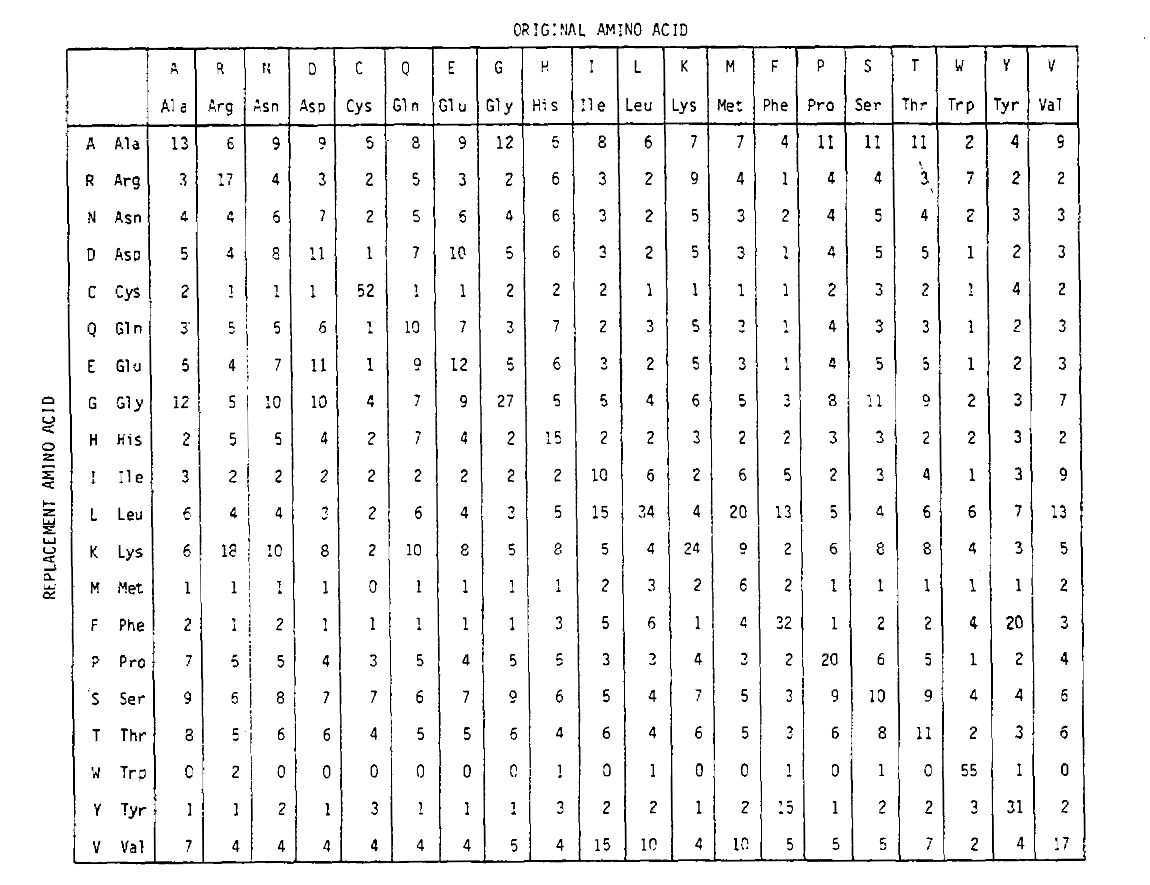
The replacement probabilities derived using this exponentiation correctly account for multiple substitutions. Not only are the off-diagonal probabilities proportionally larger as you would expect for a longer time duration, but they are flatter. For example, the probability of a valine (V) to isoleucine (I) replacement is 33× larger than a V to histadine (H) replacement in the PAM1 matrix, but only 4.5× larger in the PAM250 matrix.
Score matrices can then be calculated from the probability matrices and observed base frequencies.
The BLOSUM matrices, developed by Steven and Jorja Henikoff and published in 1992, takes a very different approach. Whereas PAM is implicitly applying a stationary finite sites model of evolution using matrix exponentiation, the effect of multiple substitutions is dealt with implicitly in BLOSUM by constructing different score matrices for different time scales.
Within multiple sequence alignments of homologous sequences, conserved contiguous blocks of amino acids are identified. Within each block, multiple sequences are clustered when their pairwise average sequence identity is higher than some threshold. The threshold is 80% for the BLOSUM80 matrix, 62% for BLOSUM62, 50% for BLOSUM50 and so on.
This means that for BLOSUM80, blocks will have average pairwise identities no greater than 80%, for BLOSUM62 no greater than 62%, et cetera.
Amino acid replacement probabilities for homologous sequences are calculated from pairwise comparisons between clusters. These probabilities will be the result of single and multiple substitutions, with multiple substitutions having greater influence at greater evolutionary distances. Therefore score matrices generated from pairwise comparisons between clusters of on average greater distance, like the BLOSUM50 matrix, will naturally account for the larger effect of multiple substitutions.
Although they take different routes, the final BLOSUM and PAM score matrices are actually pretty similar. According to Henikoff and Henikoff, the following PAM and BLOSUM matrices are comparible:
| PAM | BLOSUM |
|---|---|
| PAM250 | BLOSUM45 |
| PAM160 | BLOSUM62 |
| PAM120 | BLOSUM80 |
For more information on PAM (Dayhoff) and BLOSUM matrices, see chapter 2 of Biological sequence analysis by Durbin et al., and Wikipedia.
Update 13 October 2019: for an another perspective on substitution matrices, consult the “Detours” section at the end of Chapter 5 of Bioinformatics Algorithms (2nd or 3rd Edition) by Compeau and Pevzner.