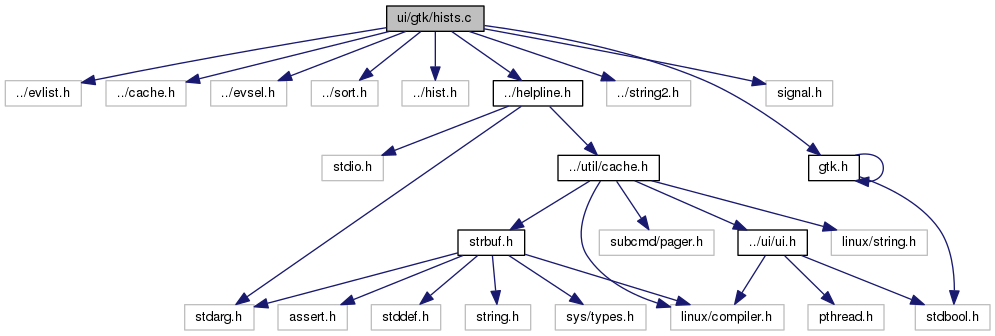
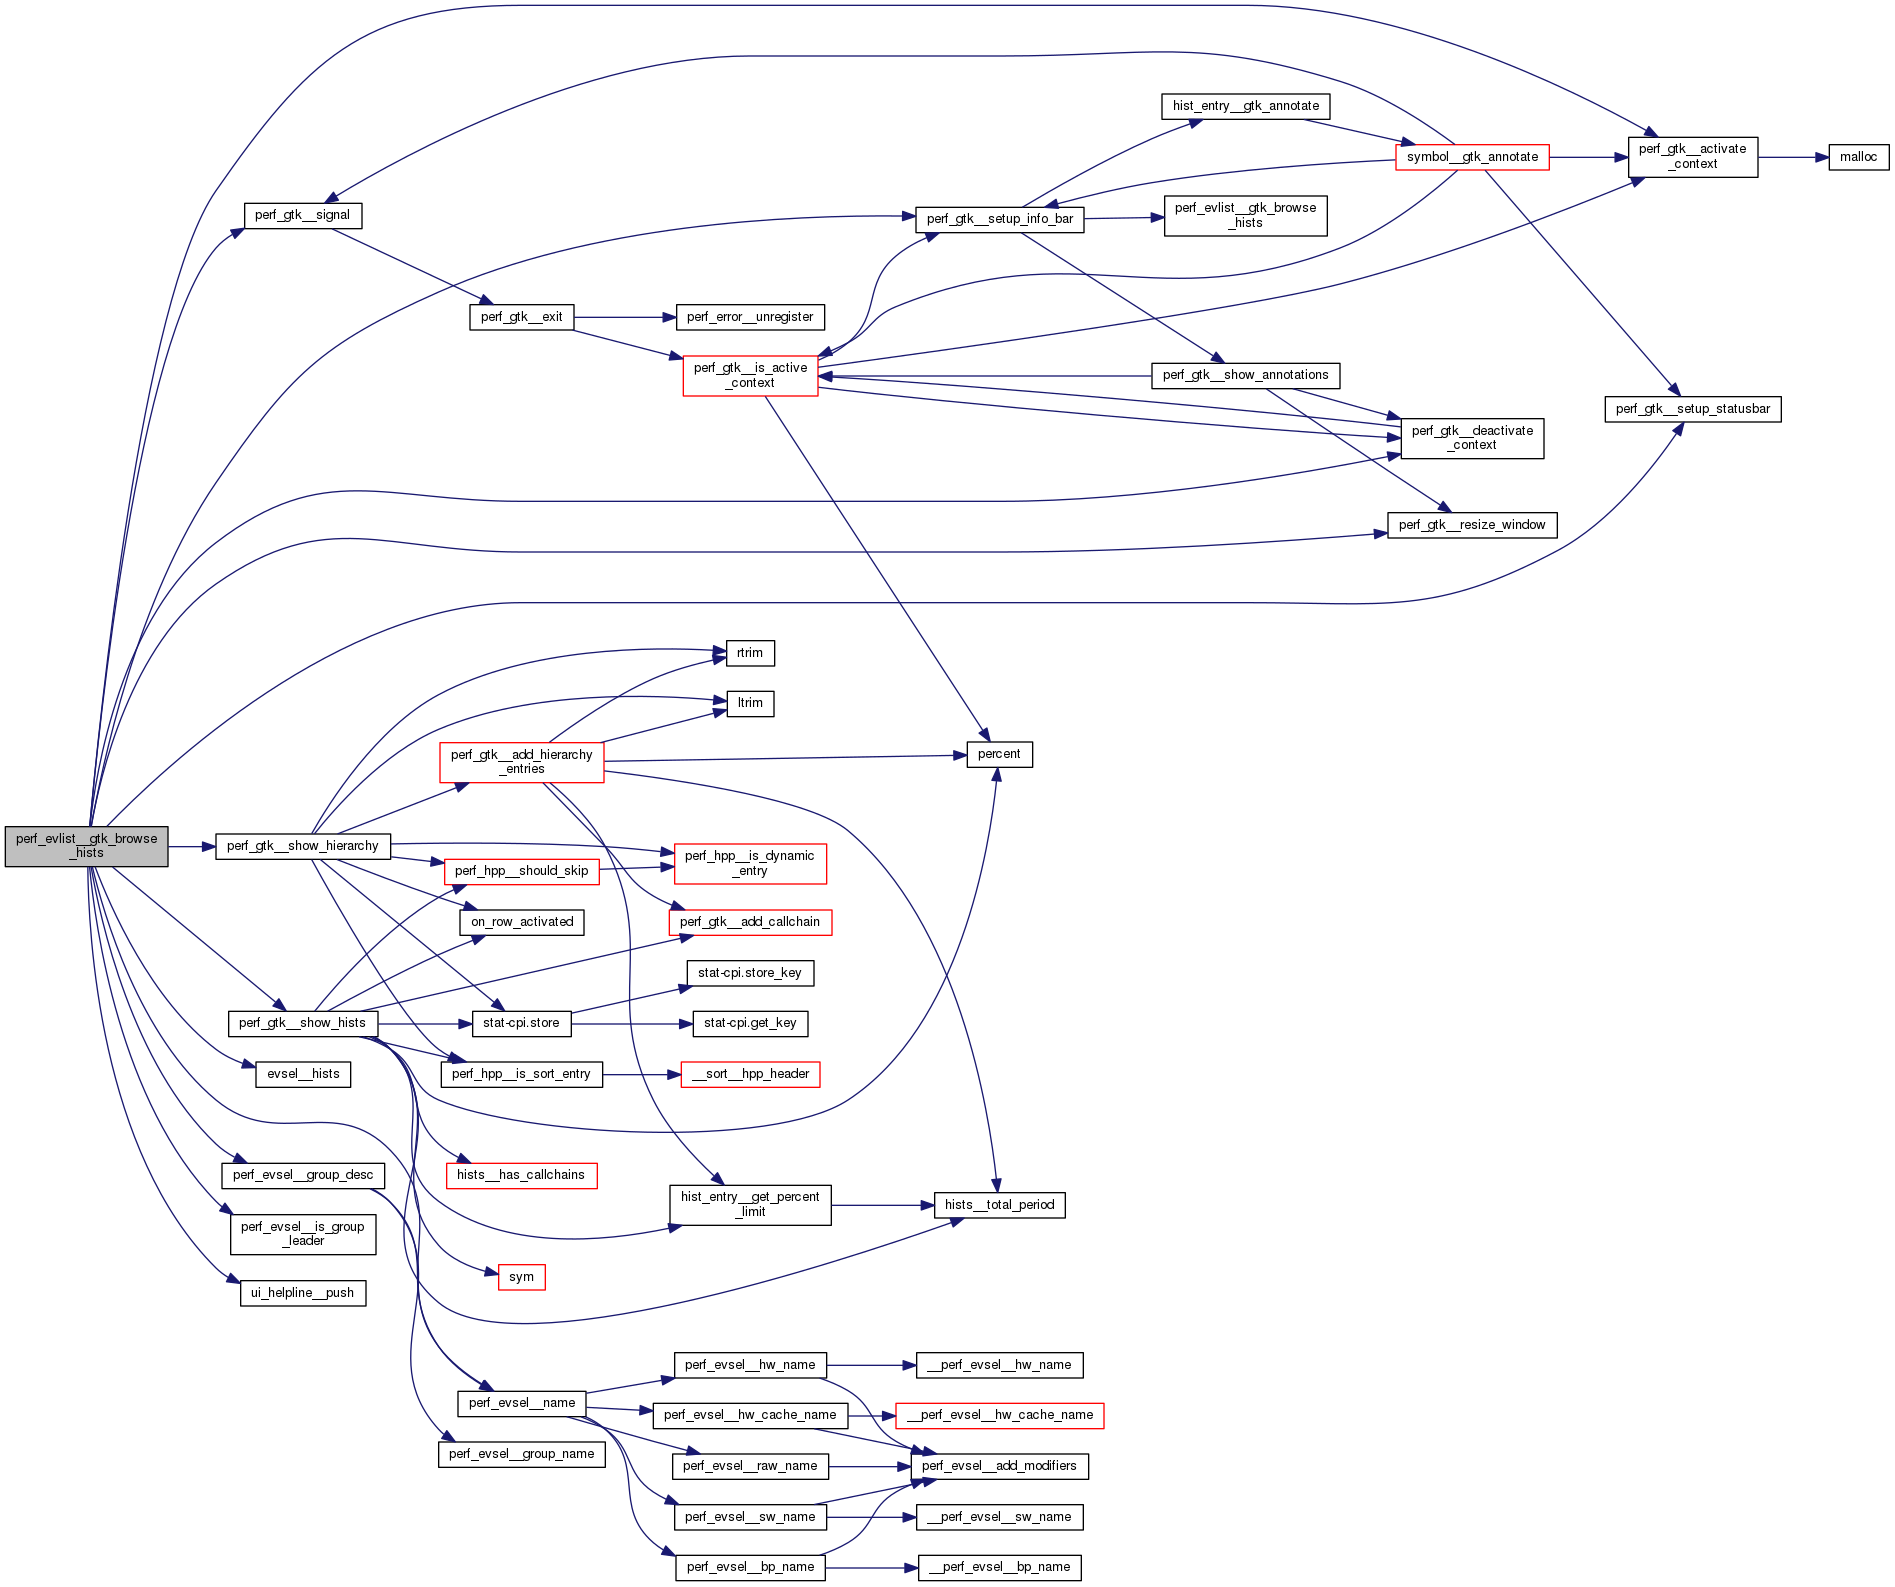
#include "../evlist.h"#include "../cache.h"#include "../evsel.h"#include "../sort.h"#include "../hist.h"#include "../helpline.h"#include "../string2.h"#include "gtk.h"#include <signal.h>
Include dependency graph for hists.c:
Go to the source code of this file.
Macros | |
| #define | MAX_COLUMNS 32 |
| #define | __HPP_COLOR_PERCENT_FN(_type, _field) |
| #define | __HPP_COLOR_ACC_PERCENT_FN(_type, _field) |
Functions | |
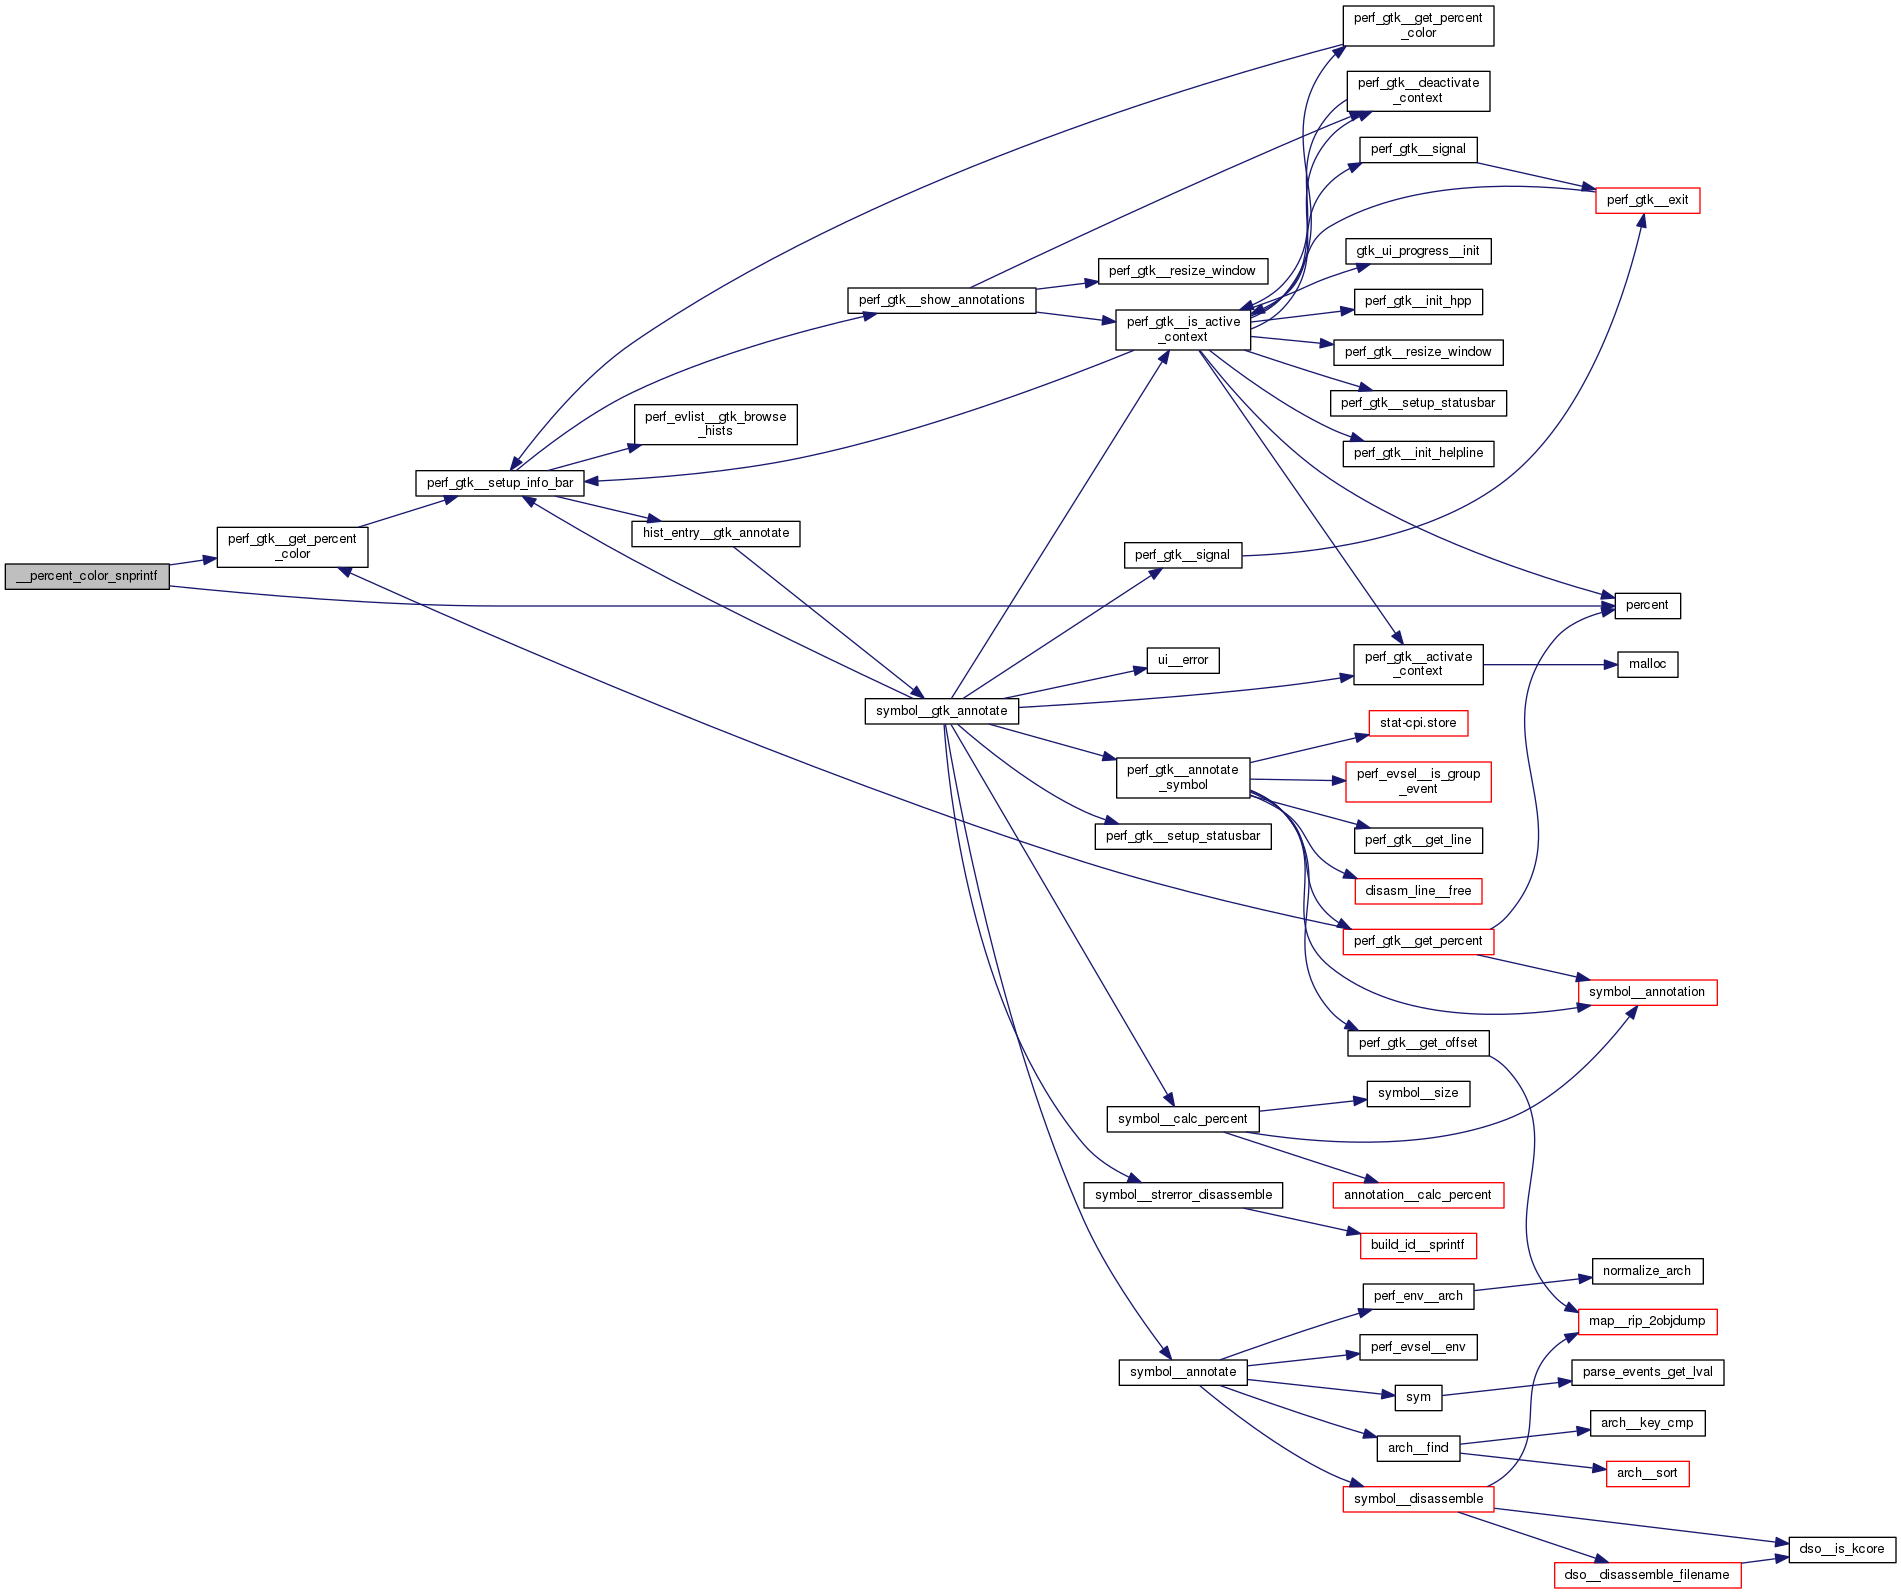
| static int | __percent_color_snprintf (struct perf_hpp *hpp, const char *fmt,...) |
| void | perf_gtk__init_hpp (void) |
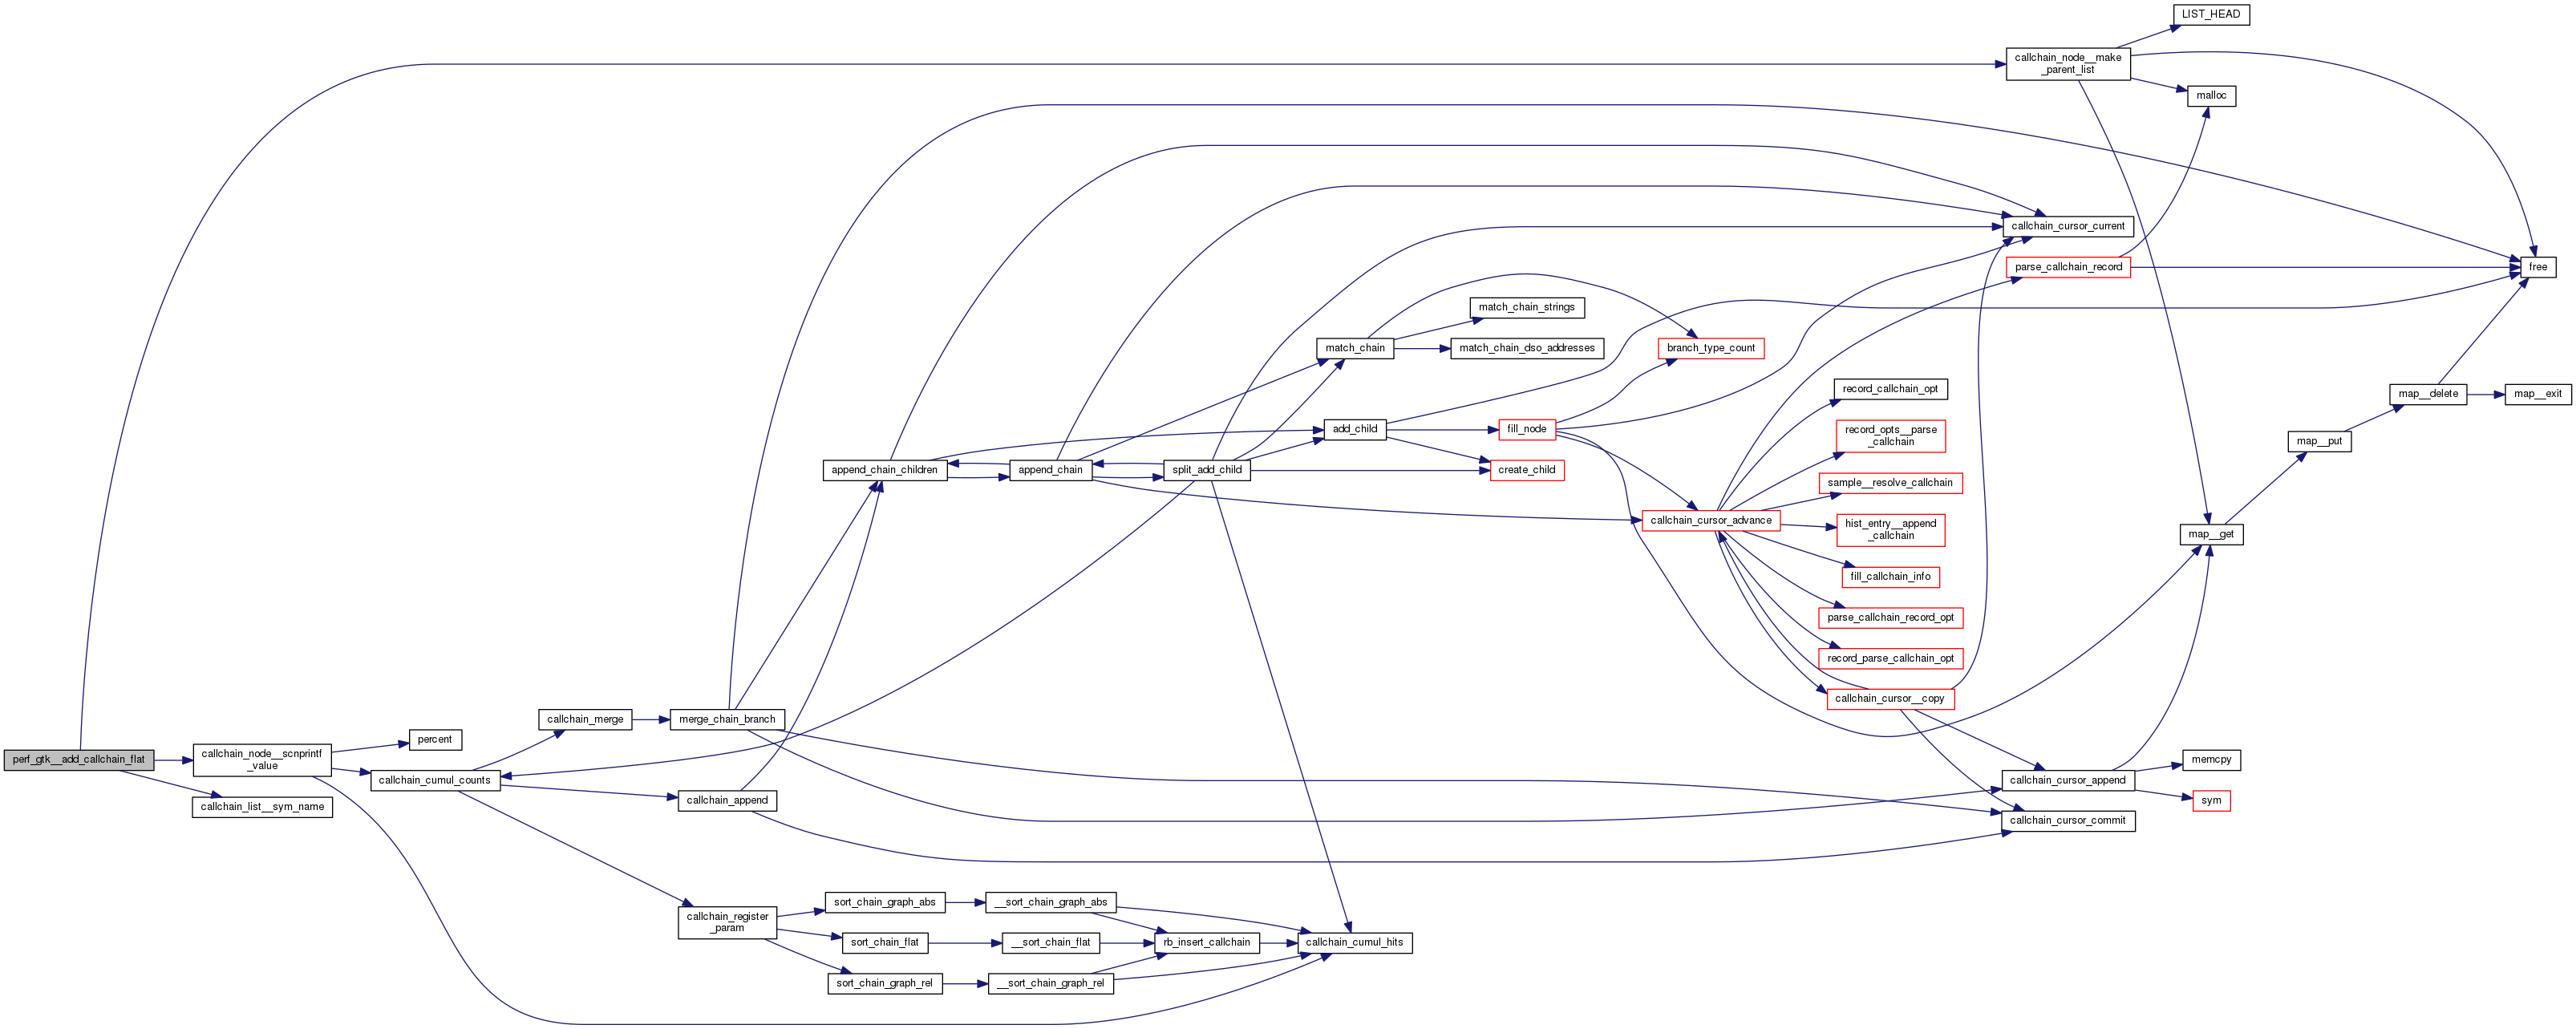
| static void | perf_gtk__add_callchain_flat (struct rb_root *root, GtkTreeStore *store, GtkTreeIter *parent, int col, u64 total) |
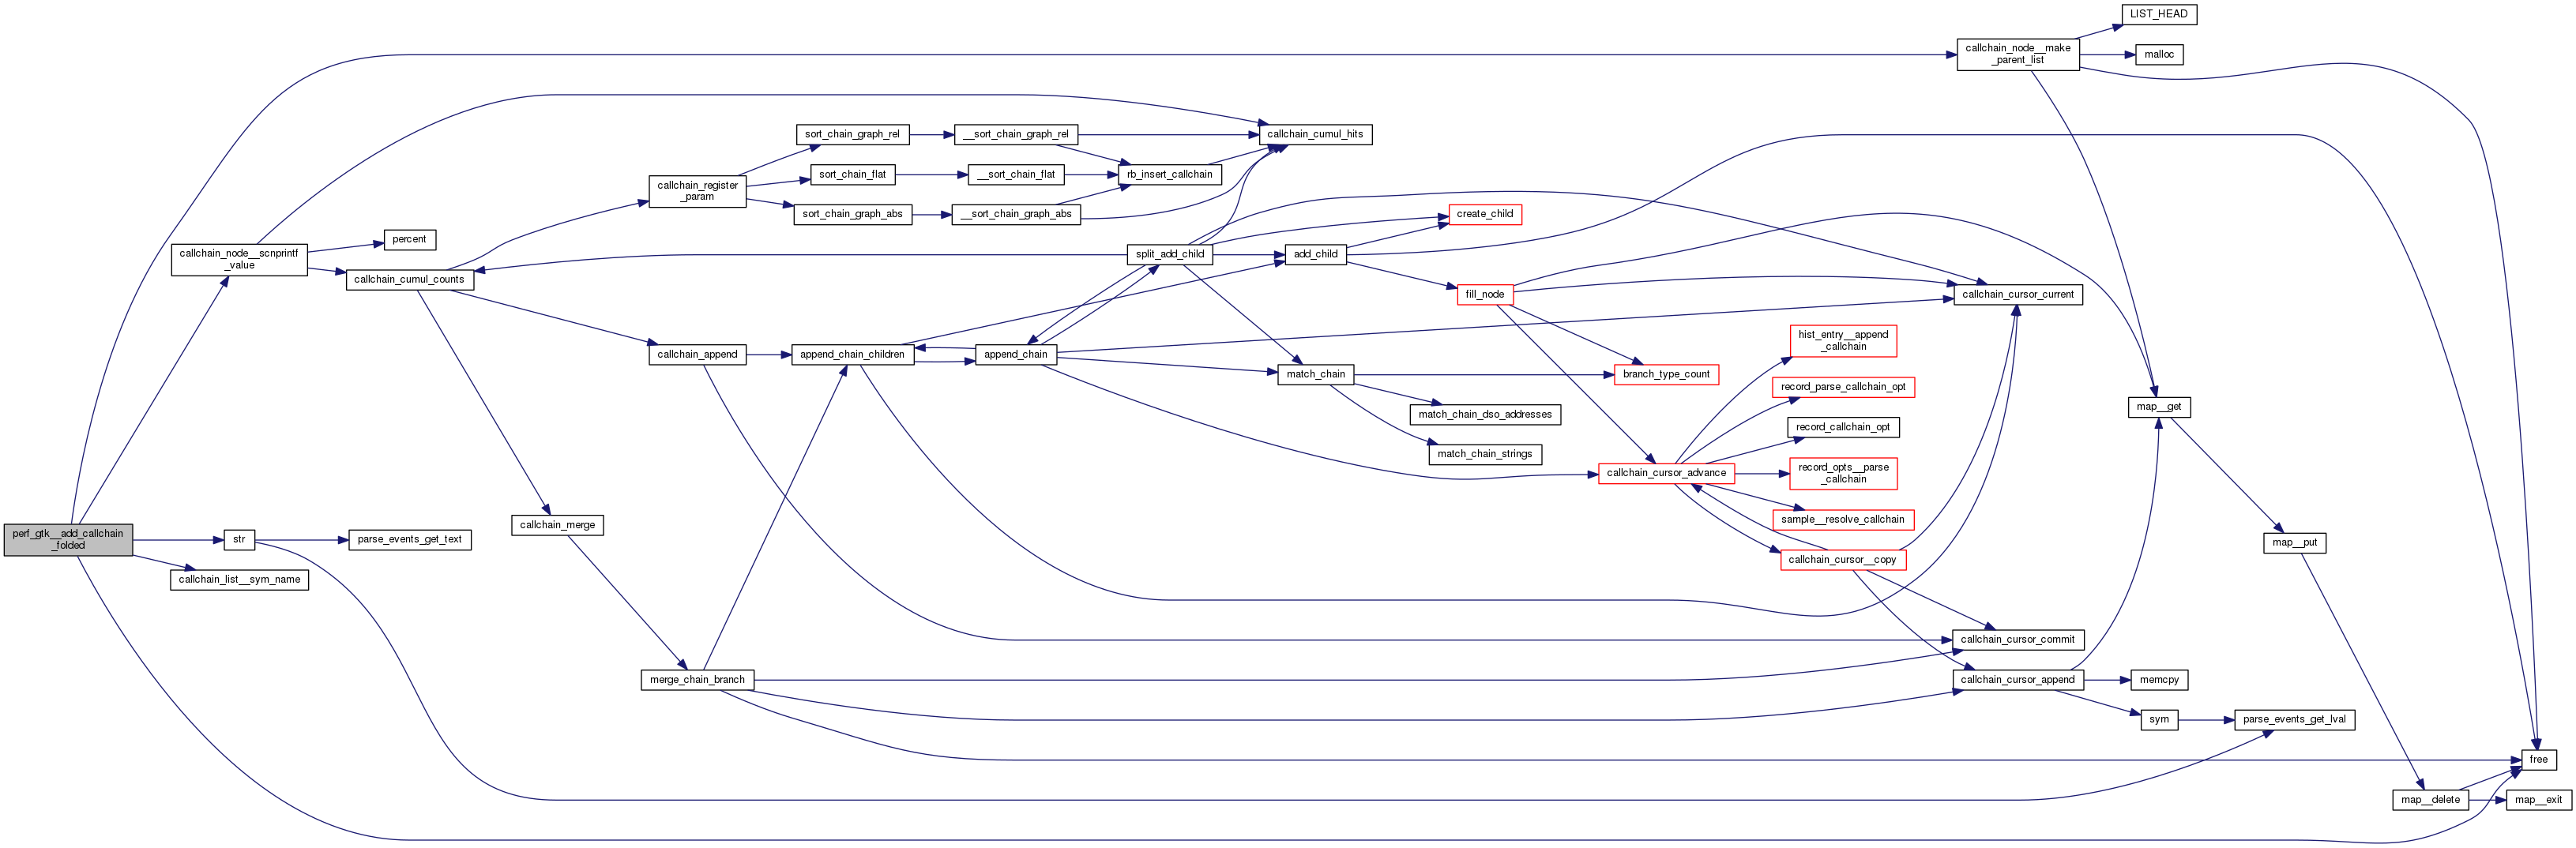
| static void | perf_gtk__add_callchain_folded (struct rb_root *root, GtkTreeStore *store, GtkTreeIter *parent, int col, u64 total) |
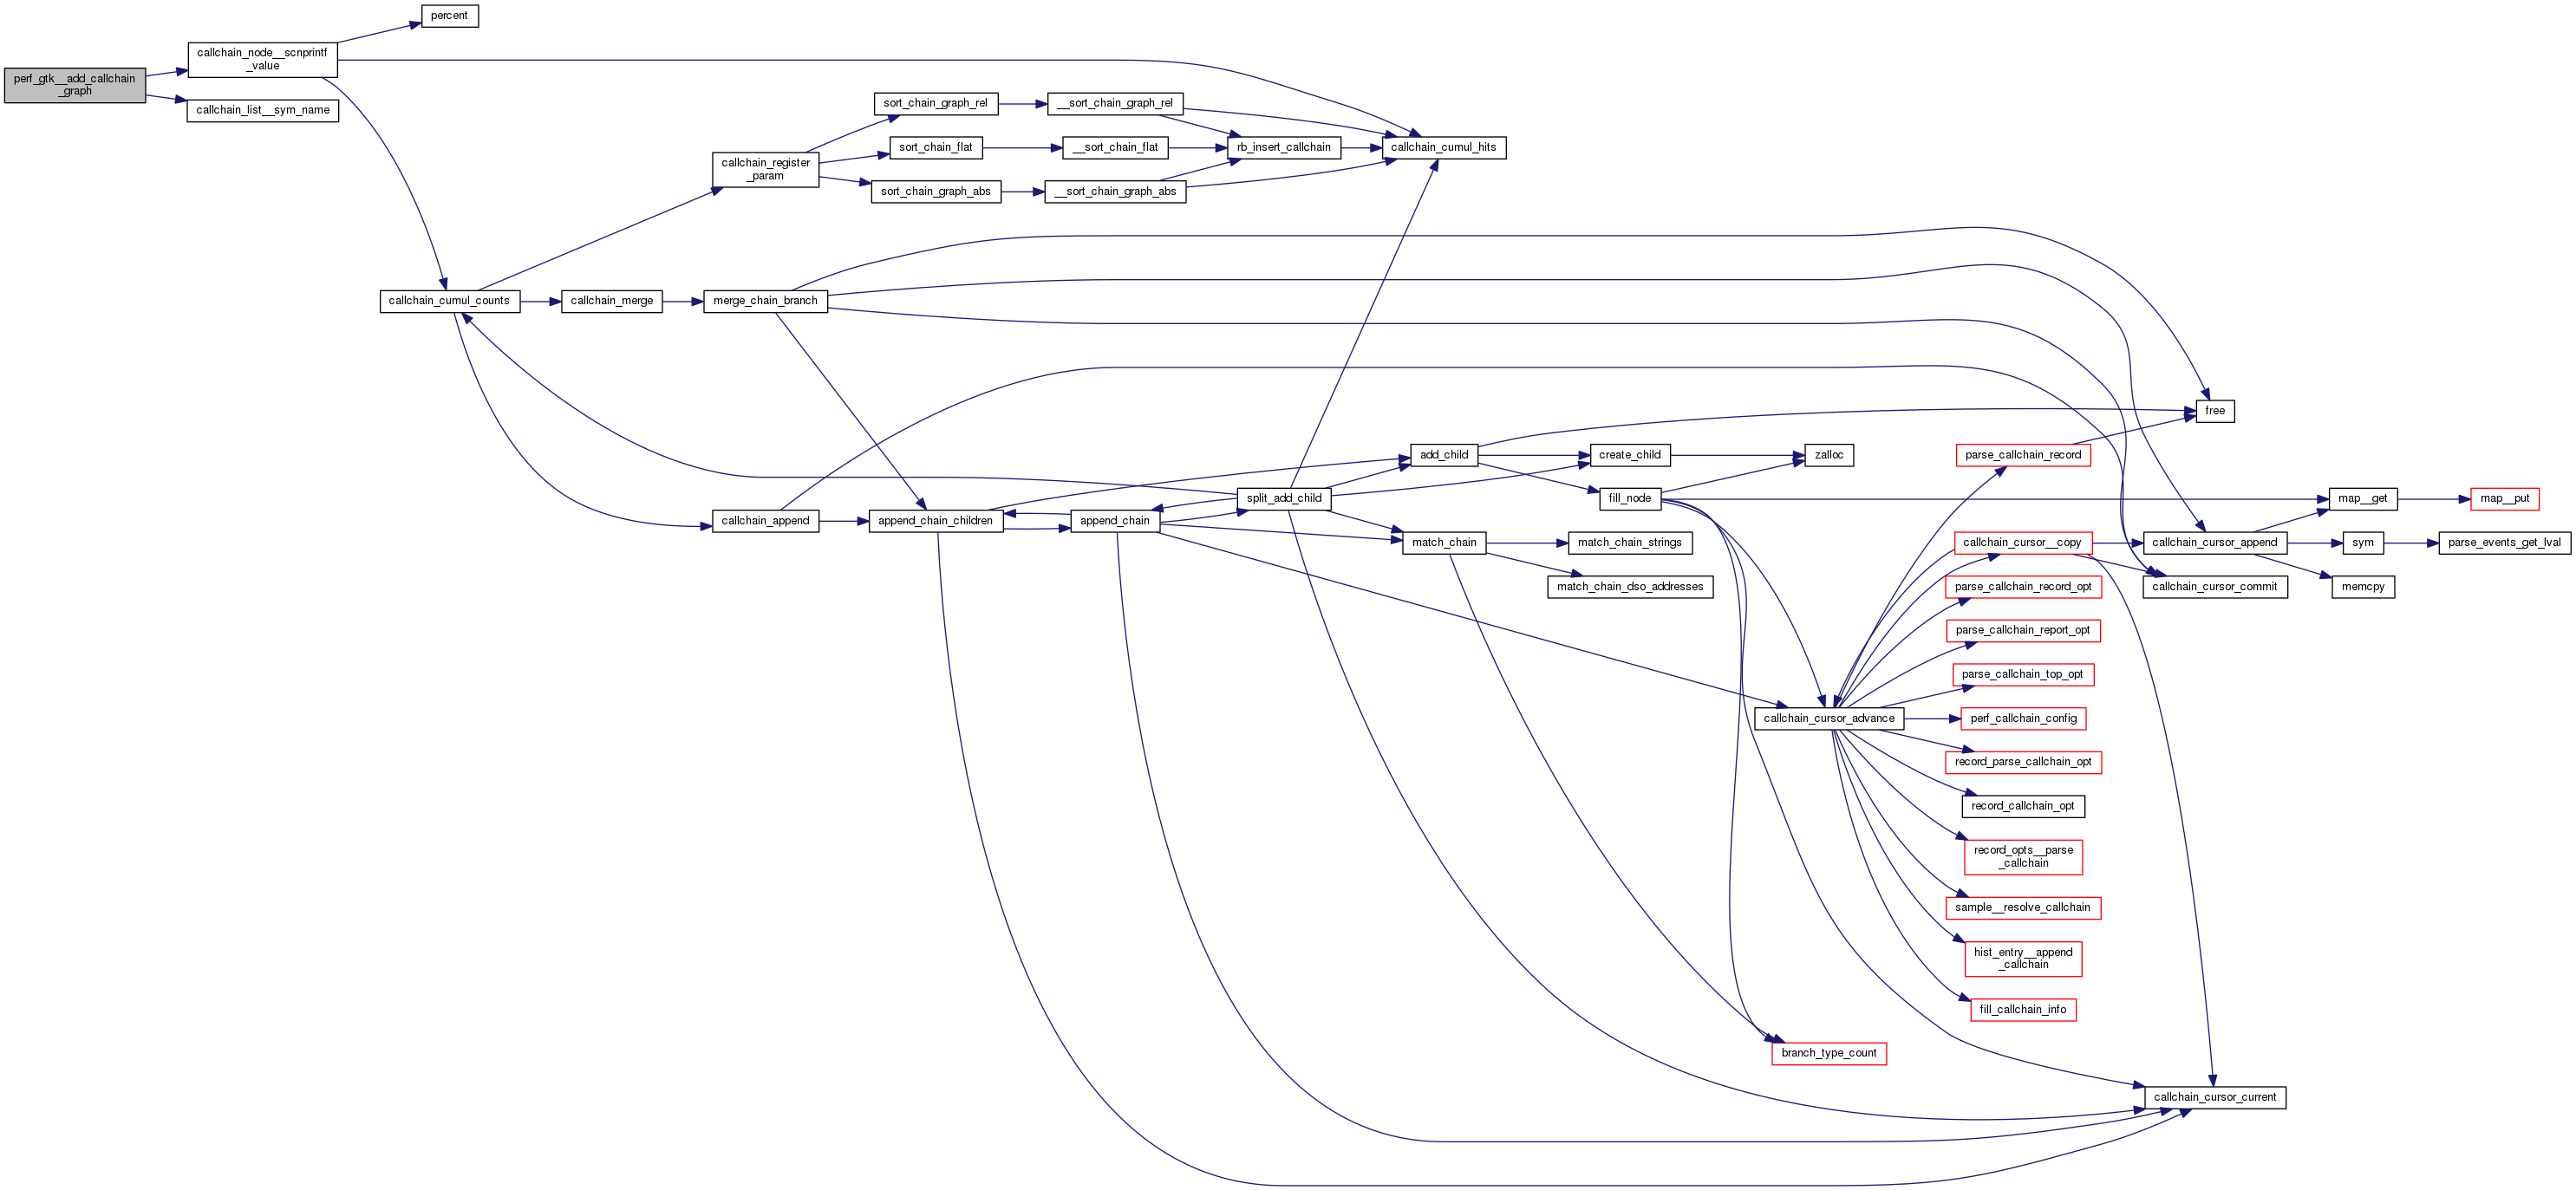
| static void | perf_gtk__add_callchain_graph (struct rb_root *root, GtkTreeStore *store, GtkTreeIter *parent, int col, u64 total) |
| static void | perf_gtk__add_callchain (struct rb_root *root, GtkTreeStore *store, GtkTreeIter *parent, int col, u64 total) |
| static void | on_row_activated (GtkTreeView *view, GtkTreePath *path, GtkTreeViewColumn *col __maybe_unused, gpointer user_data __maybe_unused) |
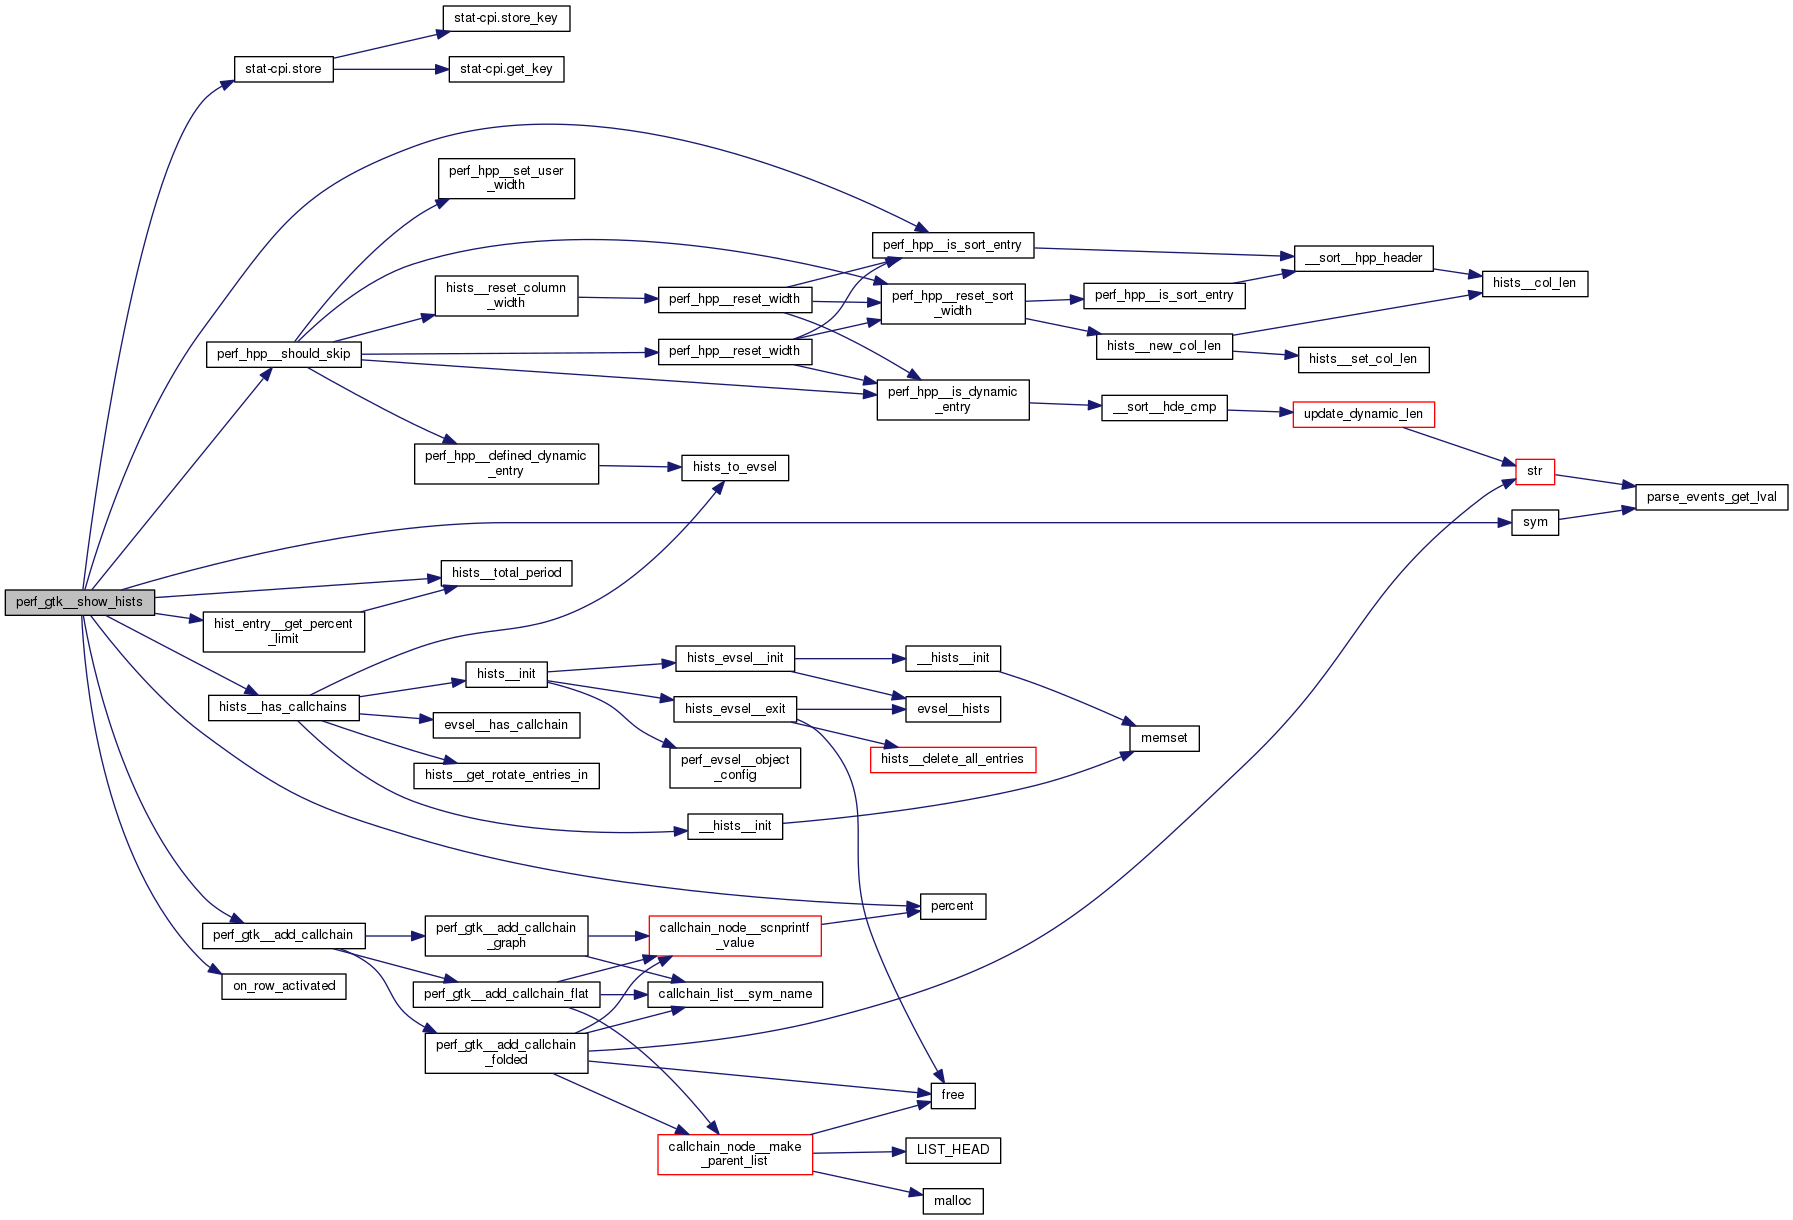
| static void | perf_gtk__show_hists (GtkWidget *window, struct hists *hists, float min_pcnt) |
| static void | perf_gtk__add_hierarchy_entries (struct hists *hists, struct rb_root *root, GtkTreeStore *store, GtkTreeIter *parent, struct perf_hpp *hpp, float min_pcnt) |
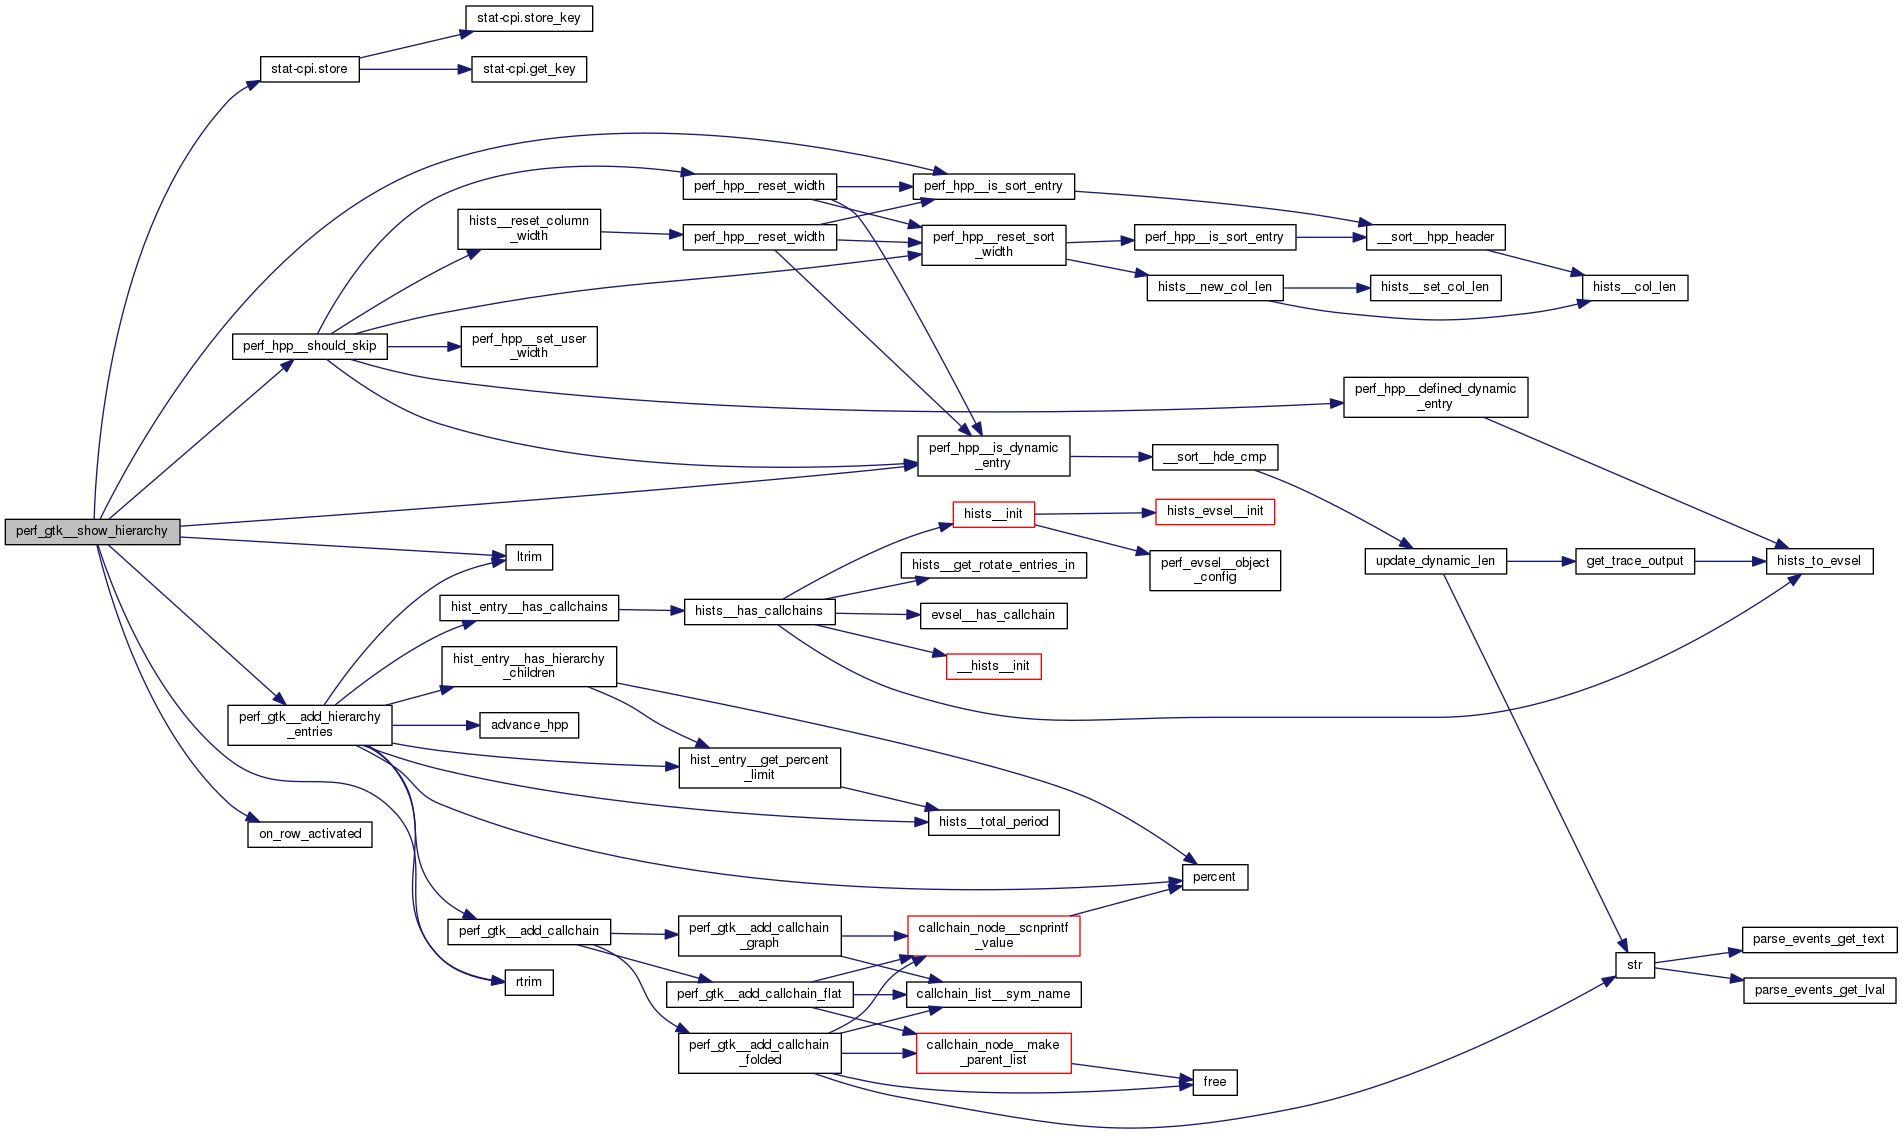
| static void | perf_gtk__show_hierarchy (GtkWidget *window, struct hists *hists, float min_pcnt) |
| int | perf_evlist__gtk_browse_hists (struct perf_evlist *evlist, const char *help, struct hist_browser_timer *hbt __maybe_unused, float min_pcnt) |
Macro Definition Documentation
◆ __HPP_COLOR_ACC_PERCENT_FN
| #define __HPP_COLOR_ACC_PERCENT_FN | ( | _type, | |
| _field | |||
| ) |
Value:
{ \
return he->stat_acc->_field; \
} \
\
struct perf_hpp *hpp, \
struct hist_entry *he) \
{ \
__percent_color_snprintf, true); \
}
int hpp__fmt_acc(struct perf_hpp_fmt *fmt, struct perf_hpp *hpp, struct hist_entry *he, hpp_field_fn get_field, const char *fmtstr, hpp_snprint_fn print_fn, bool fmt_percent)
Definition: hist.c:129
Definition: hist.h:234
Definition: sort.h:89
Definition: hist.h:241
static int __percent_color_snprintf(struct perf_hpp *hpp, const char *fmt,...)
Definition: hists.c:14
◆ __HPP_COLOR_PERCENT_FN
| #define __HPP_COLOR_PERCENT_FN | ( | _type, | |
| _field | |||
| ) |
Value:
{ \
return he->stat._field; \
} \
\
struct perf_hpp *hpp, \
struct hist_entry *he) \
{ \
__percent_color_snprintf, true); \
}
Definition: hist.h:234
Definition: sort.h:89
Definition: hist.h:241
int hpp__fmt(struct perf_hpp_fmt *fmt, struct perf_hpp *hpp, struct hist_entry *he, hpp_field_fn get_field, const char *fmtstr, hpp_snprint_fn print_fn, bool fmt_percent)
Definition: hist.c:110
static int __percent_color_snprintf(struct perf_hpp *hpp, const char *fmt,...)
Definition: hists.c:14
◆ MAX_COLUMNS
Function Documentation
◆ __percent_color_snprintf()
|
static |
◆ on_row_activated()
|
static |
◆ perf_evlist__gtk_browse_hists()
| int perf_evlist__gtk_browse_hists | ( | struct perf_evlist * | evlist, |
| const char * | help, | ||
| struct hist_browser_timer *hbt | __maybe_unused, | ||
| float | min_pcnt | ||
| ) |
◆ perf_gtk__add_callchain()
|
static |

◆ perf_gtk__add_callchain_flat()
|
static |
◆ perf_gtk__add_callchain_folded()
|
static |
◆ perf_gtk__add_callchain_graph()
|
static |
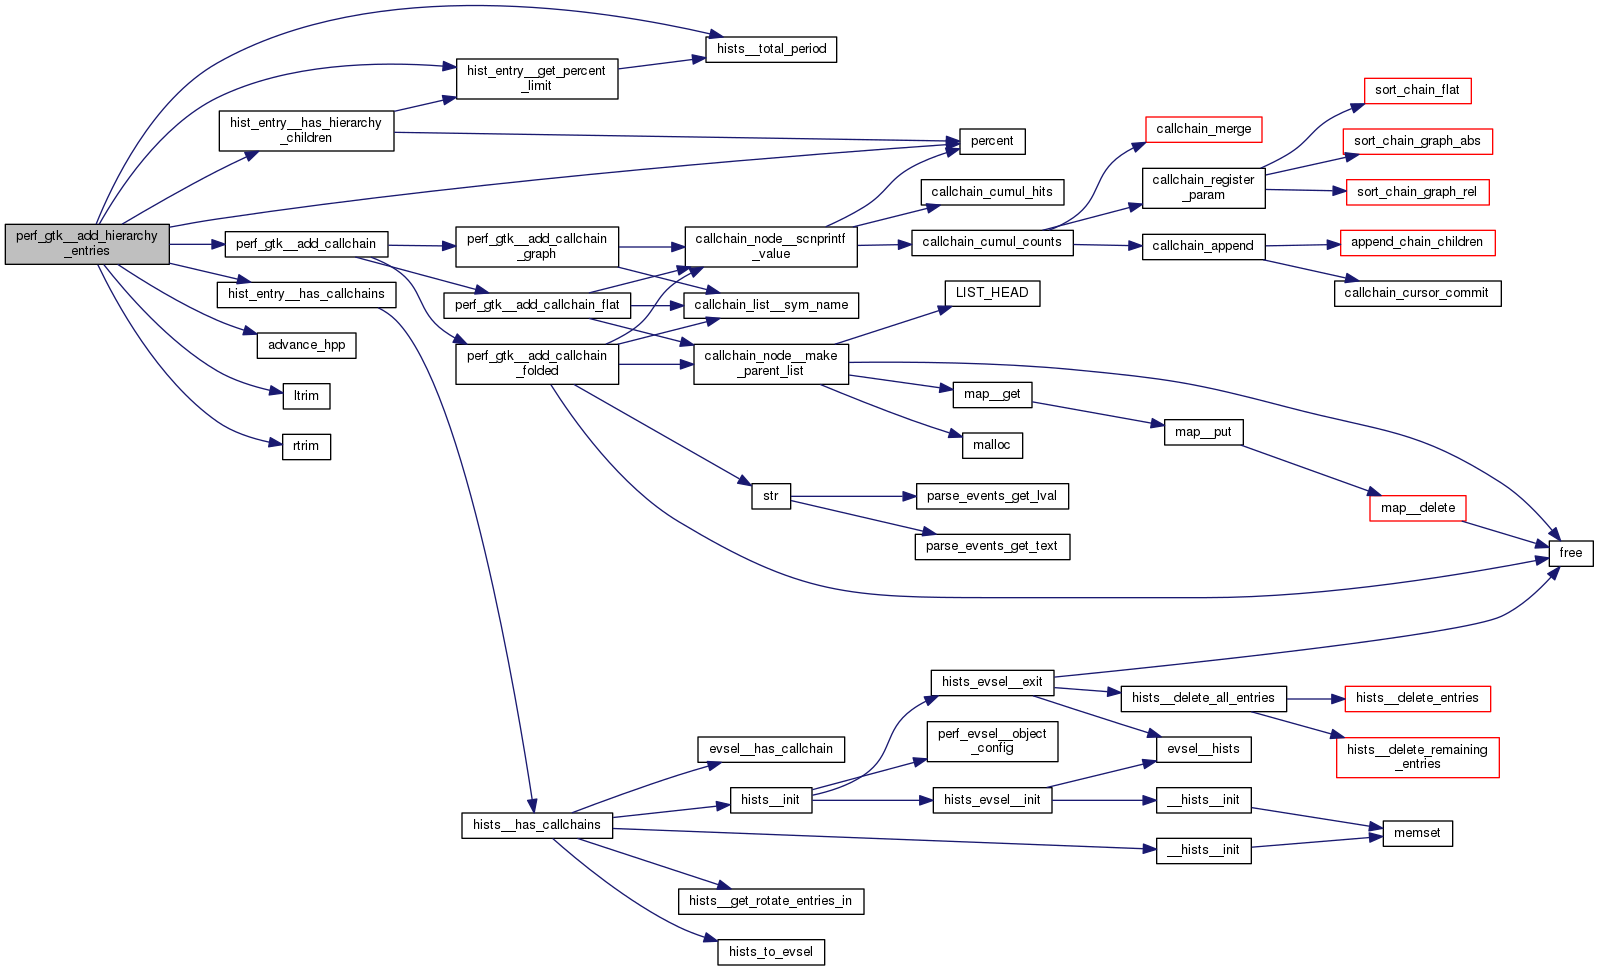
◆ perf_gtk__add_hierarchy_entries()
◆ perf_gtk__init_hpp()
◆ perf_gtk__show_hierarchy()
|
static |