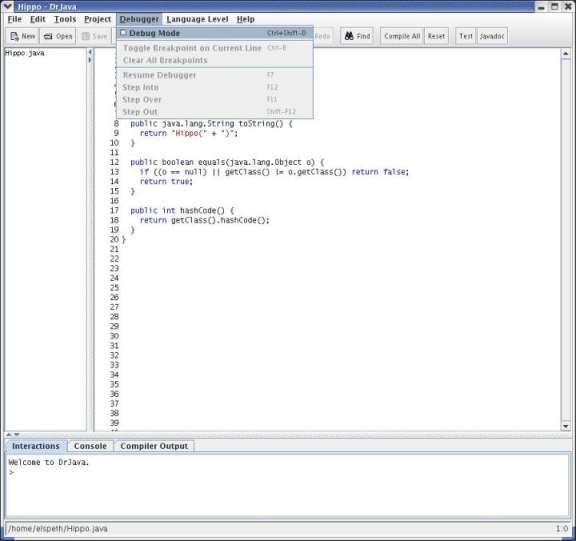
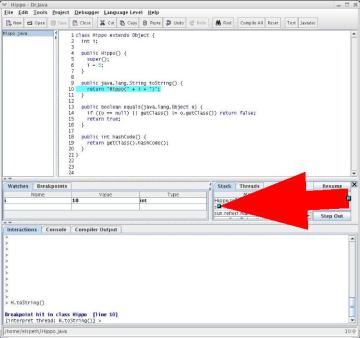
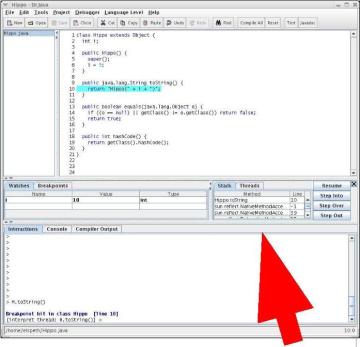
The debugger allows you to step through the execution of a program and stop at any point you choose so that you can track down bugs in your code. What makes our debugger an unusually powerful tool is that it allows you to modify the values of fields and variables while debugging! First, we will explain a little bit about how the debugger works in general, and then we will explain how you can use the Interactions Pane to modify field and variable values during runtime and thus more quickly zero in on problems in your code.
To enable the debugger, select "Debugger, Debug Mode". This will launch the debug panel in the lower part of DrJava, right above the Interactions Pane.

Debug Panel: The Debug Panel has three tabs to help you track control flow in your program. These tabs are labeled Watches, Stack, and Threads.
Watches: This is a table that displays the instantaneous values of specified fields and variables given the current line that the debugger is on. To add a watch, click in the leftmost column on the first empty row. A cursor should appear and you can type in the name of the field or variable. You can also put in expressions that require evaluation such as x + 1 or array accesses.

Stack: This a table that lists the current stackframes. Use this to determine the trail of methods that have been invoked to arrive at the current line in the execution. You can double-click on a particular stack frame to scroll to center it in the Definitions Pane.

Threads: This is list of the threads that are running in the virtual machine. If there are multiple threads that are suspended, you can set the active thread (the thread whose execution you're examining) by double-clicking on the desired thread.

Breakpoints. Another important part of the debugger is the breakpoints panel. Even when the debugger is not enabled, you can set breakpoints using the Ctrl+B shortcut or by selecting the "Toggle Breakpoint" command from the Debugger menu or the context menu. This will highlight the current line in red, and the debugger will stop the running program when it reaches this line. To remove a breakpoint again, place the cursor on the same line and press Ctrl+B again.
To view all the breakpoints you have set and to navigate between them, you can open the Breakpoints Panel by pressing Ctrl+Shift+B or selecting the "Breakpoints" command from the Debugger menu. In this panel, all currently set breakpoints are listed, sorted by document and line number. To move the cursor to the location of a breakpoint, double-click on one of the entries in the Breakpoints panel, or select it and press the "Go to" button.
You can also select one or more breakpoints and use the "Enable" or "Disable" button to temporarily enable or disable the selected breakpoints. If a breakpoint is disabled, it remains set, but the program will not stop there. This is useful if you may need a breakpoint again later, but want it ignored right now.
With the "Remove" button, you can remove one or more selected breakpoints. The "Remove All" button clears the entire list of breakpoints.
Breakpoints are considered part of a project and are therefore saved to and restored from a project file.
